Yesterday I was involved in a live chat with Chris Lintott and Rob Simpson from The Zooniverse. We used a Google+ hangout to video chat about recent Galaxy Zoo science (my paper) and also answer questions from members of the public on future plans for Galaxy Zoo.
You can view the whole chat (30 minutes) on The Zooniverse YouTube Channel.
The Zooniverse plans more of these events, so let us/them know what you liked about it and what didn't work.
Wednesday, May 30, 2012
Friday, May 25, 2012
Take 2 on Science Magazine Placement
Following my innocent tweet last month about the placement of New Scientist in a local Tesco Express I made a Storify of all the retweets and responses: Science Magazines are a Men's Interest.
Tesco promised to look into it. As of 10 days ago I hadn't heard anything and I happened to be in another local Tesco and saw this:
So I thought I'd go again (but this time left it too late to make up a Storify it seems, so just a series of pictures of tweets below).


However I am still disappointed that Tesco have kept the "Men's Interest" category at all - it seems unnecessary. Any comments on that choice?
 |
| The original picture. Tesco Express, Gunwharf Quays, Sunday 22nd May 2012 |
Tesco promised to look into it. As of 10 days ago I hadn't heard anything and I happened to be in another local Tesco and saw this:
 |
| Take 2: Tesco Express, Elm Grove, Portsmouth, Monday 14th May 2012 |
So I thought I'd go again (but this time left it too late to make up a Storify it seems, so just a series of pictures of tweets below).


However I am still disappointed that Tesco have kept the "Men's Interest" category at all - it seems unnecessary. Any comments on that choice?
My latest paper accepted in MNRAS.
A cross posting from the Galaxy Zoo blog.
I'm delighted to announce that the latest paper based on Galaxy Zoo classifications was accepted to appear in the Monthly Notices of the Royal Astronomical Society earlier this week, and appears on the arxiv this morning (link).
Usually there is a long delay between submission and acceptance of papers (something Kevin discussed on the Galaxy Zoo blog in "What Happens Next - Peer Review"), but in this case the initial referee report came back after 2 days, and the paper was accepted only 2 weeks after the first submission so I never got time to post to the arxiv or write a blog post about it before it was accepted! This was certainly the smoothest and fastest referee process I've been through. ;)
Here's the title page.

So what was new about this paper was that we combined information on the morphologies (whether or not the spiral galaxies had bars) with information on the amount of atomic hydrogen gas the galaxies contained and and our main result was that galaxies with more atomic gas in them, are less likely to have a bar. But I want to back up a bit first and tell you about where we get this information on the atomic gas content, and why it might be interesting. As you might guess from the title of the paper it's from something called the ALFALFA survey (and the new names in the author list for a Galaxy Zoo paper - Martha Haynes and Riccardo Giovanelli - are from Cornell University who are running this survey). Atomic hydrogen emits radio waves at a frequency of 1.4 GHz (or 21cm). This is detectable by a classic radio telescope (in what we call the "L"-band which makes up the second L of ALFALFA). In the case of ALFALFA, we use the Arecibo radio telescope (two of the "A"s in the acronym stand for Arecibo, the third is for array), which is the worlds biggest single dish radio telescope deep in the jungle of Puerto Rico.
ALFALFA is a massive survey which will map the location of atomic hydrogen over basically the whole sky visible to the Arecibo radio telescope. What's neat about a survey for something which emits as a specific frequency is that you actually get a 3D map of where the hydrogen is - both redshift and sky position! Anyway, we made use of about 40% of the survey which is already complete, and which covers about 25% of the area of the sky in which the Galaxy Zoo galaxies are found (the Sloan Digital Sky Survey Legacy Area). Adding some cuts on how face-on the galaxies are so that the bars can be identified, and to make sure the sample contains the same size galaxies right through it's volume we ended up with 2090 galaxies with both atomic hydrogen detections and bar classifications from you guys. This is an order of magnitude larger than any similar sample! So thanks. :)
Atomic hydrogen is the basic building block of galaxies (after dark matter). It represents the fuel for future star formation in a galaxy - a galaxy with a lot of atomic hydrogen could in principle make a lot of new stars. Many spiral galaxies have a lot of atomic hydrogen (with perhaps as much as 10 times as much mass in hydrogen as in stars!), while a typical elliptical galaxy has very little atomic gas, and so cannot form lots of new stars.
So our observation that bars are more likely to be found in spiral galaxies with less atomic gas supports our earlier ideas about bars possibly "killing" spirals (ie. helping to stop them form stars).
Of course it's never quite that straightforward with galaxies. To start with correlation is not the same as causation, and to that we add that lots of things are correlated. We show some of that in the figure above. Bars are more likely in redder spirals which have more stars ("log Mstar" represents stellar mass in units relative to the mass of our Sun) and which also have less atomic gas. So the skeptical astronomer could say this has nothing to do with the gas content at all, just that the types/sizes of galaxies with less bars have more gas. To test that idea we measured the typical gas content of a spiral galaxy with a given number of stars, and from that we calculated how "deficient" or rich in atomic hydrogen any given galaxy was. Then we plotted the bar fraction against that. The convention in astronomy is to call how much less atomic hydrogen a galaxy has than normal it's "HI deficiency" which gets bigger the less atomic hydrogen there is (from the people who brought you the magnitude scale!).
Anyway you can see we still see a clear trend, which demonstrates that it's likely to be the atomic gas driving the correlation. Where a galaxy is richer in atomic hydrogen than normal it's less likely to host a bar, and vice versa. Very atomic hydrogen rich galaxies which are massive and have bars are really quite rare!
Here are some examples of low and high mass galaxies which are gas rich or poor and with or without bars. :)
[/caption]
I made images of the whole sample we use available here.
At the end of the paper we put forward three possible explanations for the correlation, all of which fit in with the observations we presented. It's possible that the bars are causing the atomic gas in galaxies to be used up faster - "killing" the galaxy. The bar does this by driving the gas to the centre of the galaxy where it gets denser, turns into molecular hydrogen and from that stars (but only in the centre). It's also possible (based on dynamical studies of galaxies) that gas slows down the formation of a bar in a spiral galaxy, and/or destroys the bar. Finally it's possible that as a galaxy interacts with its neighbours, a bar gets triggered and its gas gets stripped (ie. the correlation between the two is caused by an external process). We'll need to do more work to figure out which of these (or which combination of them) is the most important.
To my mind the most interesting result was a hint that if a gas rich galaxy does (rarely) host a bar, it's optically redder than similar galaxies without bars. It's just possible that bars hold back infall of gas from the outer regions of a spiral galaxy and slow down star formation over all in that galaxy. That idea needs testing, but if it's true it's saying that an internal structure like a bar plays an important role in the global star formation history of a galaxy.
Anyway thanks again for the classifications! ;)
So what was new about this paper was that we combined information on the morphologies (whether or not the spiral galaxies had bars) with information on the amount of atomic hydrogen gas the galaxies contained and and our main result was that galaxies with more atomic gas in them, are less likely to have a bar. But I want to back up a bit first and tell you about where we get this information on the atomic gas content, and why it might be interesting. As you might guess from the title of the paper it's from something called the ALFALFA survey (and the new names in the author list for a Galaxy Zoo paper - Martha Haynes and Riccardo Giovanelli - are from Cornell University who are running this survey). Atomic hydrogen emits radio waves at a frequency of 1.4 GHz (or 21cm). This is detectable by a classic radio telescope (in what we call the "L"-band which makes up the second L of ALFALFA). In the case of ALFALFA, we use the Arecibo radio telescope (two of the "A"s in the acronym stand for Arecibo, the third is for array), which is the worlds biggest single dish radio telescope deep in the jungle of Puerto Rico.
 |
| Aerial shot of Arecibo. Credit: NAIC. |
 |
| Trends of bar fraction with atomic gas content, galaxy colour and how many stars are in a galaxy. |
 |
| Bar fraction against how much more or less atomic gas a galaxy has than is typical for the number of stars it has. Bigger HI deficiency = less atomic gas than is normal for a galaxy's size. |
 |
| Example images. |
At the end of the paper we put forward three possible explanations for the correlation, all of which fit in with the observations we presented. It's possible that the bars are causing the atomic gas in galaxies to be used up faster - "killing" the galaxy. The bar does this by driving the gas to the centre of the galaxy where it gets denser, turns into molecular hydrogen and from that stars (but only in the centre). It's also possible (based on dynamical studies of galaxies) that gas slows down the formation of a bar in a spiral galaxy, and/or destroys the bar. Finally it's possible that as a galaxy interacts with its neighbours, a bar gets triggered and its gas gets stripped (ie. the correlation between the two is caused by an external process). We'll need to do more work to figure out which of these (or which combination of them) is the most important.
To my mind the most interesting result was a hint that if a gas rich galaxy does (rarely) host a bar, it's optically redder than similar galaxies without bars. It's just possible that bars hold back infall of gas from the outer regions of a spiral galaxy and slow down star formation over all in that galaxy. That idea needs testing, but if it's true it's saying that an internal structure like a bar plays an important role in the global star formation history of a galaxy.
Anyway thanks again for the classifications! ;)
Friday, May 18, 2012
The Transit of Venus and the Scale of the Universe
(This is based on content I've been developing for upcoming talks on the transit of Venus, which are May 24th to the Pompey Physics Society; May 25th Dom giving talk at Portsmouth Grammar School, and Tuesday June 5th, 1.30pm and 2.30pm Workshop on board HMS Warrior in the Portsmouth Historic Dockyard. Also was used as a basis for this blog post for my Zooniverse friends over at Planethunters. )
On 5th/6th June 2012 Venus will pass between the Earth and the Sun. It's shadow will cross the Sun taking about 6 hours in total, although the length of that which is visible varies significantly depending on where you live on Earth. In the USA the beginning of the transit will be visible as the Sun begins to set on 5th June, while in the UK we'll see the end of the transit after the Sun rises on 6th June.
The planet Venus orbits the Sun inside the orbit of the Earth, and passes between the Earth and the Sun quite frequently. However the planes of the two orbits aren't quite aligned, so most of the time Venus passes either above or below the disk of the Sun. Actual transits are rare, but very predictable. They happen in pairs separated by 8 years, and then after each pair follows a period of either 121.5 or 105.5 years without any transits. The 2012 transit is the second of a pair - astronomers around the world viewed the first transit of the modern age in 2004, and the next transit won't happen until December 2117.
To view a transit of Venus does not need to be technically challenging, but in its simplest form involves looking at the Sun - so some safety precautions must be taken. You must never look directly at the Sun! Serious eye damage or even blindness could occur if you did that, so take this warning seriously! My advice for viewing the transit if you are not a keen amateur astronomer, or able to get to a viewing party, is to either get your hands on a pair of Safe Solar Viewers (like these ones from Astronomers Without Borders), or to view the event via a web cam (like this one from Hawaii where the entire transit is visible, or GLORIA which is planning to show feeds from Australia, Japan and Norway). This last method also has the advantage (especially for UK viewers) of not being affected by local cloud cover, and has exactly zero risk of eye damage! If you come to one of my talks I hope to have solar viewers to hand out.
So why should you care about a black dot crossing the Sun, or perhaps more pertinently, why do I, and an astronomer who studies galaxies, and works in a cosmology department care enough to write a blog post about it and give several talks? Well historically transits of Venus have been very important in helping astronomers understand the scale of the solar system, and from that the scale of the Universe. Basically when Venus crosses the Sun we know that it, the Sun and the Earth are all in a straight line. Very slight differences in the viewing angle from two observers on the Earth can then be used along with our basic knowledge of trigometry to measure the distance to the Sun. For over 100 years, the distance to the Sun measured this way was the most accurate measurement we had.

From knowing the distance to the Sun, we can use slight changes in the apparent position of nearby stars as the Earth orbits the Sun to get their distances (more triangles - this is called the parallax method), and from those stars we calibrate methods which use stars of known or estimated brightness to estimate distances to nearby galaxies, and we jump from distances to nearby galaxies to more distant galaxies and eventually the whole universe. The distances to faraway galaxies have taught us that the universe is expanding and started in a Big Bang around 15 billion years ago, and even if we go to the observations that suggest the universe contains a mysterious "Dark energy" (which won the 2011 Nobel Prize in Physics), they are ultimately based on us knowing the distance to the Sun. So that's why I think it's important.
Here in Portsmouth we're running a workshop about the transit of Venus on HMS Warrior, in the Portsmouth Historic Dockyard. We plan to demonstrate the triangulation method by using it to estimate the distance from the Warrior to the local landmark "The Spinnaker Tower". Two people will stand on the desk and we'll mark out from them the direction to the Spinnaker Tower. Making one of the angles a right angle, we can then estimate the distance to Spinnaker (which is about 300m) by d = b/cos A, where A is the other angle, and b is the distance between the two people on deck.
This isn't exactly the method used in the historical measurements, but it demonstrates the idea. Of course when observing the transit of Venus from two widely separated places on Earth, it's not as easy to measure the angle between the sight lines. What Edmund Halley figured out in 1678 was that if you could measure the times when Venus stars and ends its transit you can get at the same information.
In all of recorded history, we have records of a total of six transits of Venus that have been observed (1639, 1761, 1769, 1874, 1882 and 2004). You have to feel sorry for Johannes Kepler, who predicted the transit which occured in 1631, but then died in 1630. No-one is recorded to have used his prediction that year. Jerimiah Horrocks and Willam Crabtree (two British astronomers who were friends) have the honour of being the first humans known to have seen Venus transit. Horrocks found and improved Kepler's earlier predictions, and both men successfully observed the 1639 transit from Northern England (in December!).

Scientific observation of the transit started in the 18th century following Halley's suggestion to use it to measure the distance to the Sun. There is a hugely rich and entertaining history of these expeditions to view the transit, and several books have been published. I'm just going to tell you a couple of the stories which struck my interest! A lot more, and links to some of the books can be found via the Wikipedia page on Venus Transits, TransitofVenus.org, and TransitofVenus.nl.
For the 1761 transit, two famous explorers got involved. Mason and Dixon (still in Britain, and before they set off to map the USA) were commissioned by the Royal Society to observe the transit from Sumatra. They met in Portsmouth, and set sail from here on HMS Seahorse (which a decade later would have a famous midshipman named Horation Nelson). Enroute to Sumatra they got attacked by the French (the French and English being at war then), and decided to give up. They wrote the Royal Society of their intentions and were promptly told they better get right back on the ship to observe the transit or else. They did, and eventually ended up viewing if from South Africa.
The 1769 transit also had some famous viewers. Captain Cook was ordered to set sail in HMS Endeavour, partially to observe the transit from Tahiti, but then to continue on and look for the mythical "Australia". On that trip they didn't find Australia, but they did land and claim New Zealand. And in Tahiti, they set up a "Fort Venus" from which to stay safe from the natives and view the transit. This voyage is being repeated this year in a replica vessel, and you can follow along at the HMB Endeavour Website.

These 18th century observations results in a measurement of the distance to the Sun of 153+/-1 million kilometers, which was a huge improvement over previous estimates, but not as good as they expected. The timings were thwarted by something which came known as the "black drop effect" where the shadow of Venus seems to bleed into the edge of the Sun. This meant that the start time of the transit could not be measured to better than a few seconds.
In 1874 several more expeditions set out, including several on Royal Navy Ships, such as HMS Volage, one of the largest mixed sail and steam ships ever built, which ferries the British expedition to the Kerguelen Island in the Southern Indian Ocean. Such measurements helped improve the distance measurement to 149.59+/-0.3 million kilometers.
By 1881 it had been decided the distance to the Sun could be estimated better by other methods, although several expeditions still set out, and the first photographs of the transit were taken.
The current best distance to the Sun is 149.5978707 million kilometers, +/- 3 metres, measured using radar ranging to the inner planets. It's known so accurately that we can measure it's changing, growing about 15 metres every century.
The first transit of Venus to happen in the modern age was in 2004. You can find videos online of this event (like the one below), which I was lucky to view from a small observatory near Ithaca, NY while I was studying for my PhD in Astronomy at Cornell University.
For the 2012 transit, apart from encouraging people to view the event as a last in your life time chance, there are couple of new developments. First smart phone technology which didn't even exist in 2004 has allowed the development of a "Transit of Venus Ap". In this Ap you can input the time you view the transit starting and/or ending, and participate in a global experiment to measure the distance to the Sun. Download the Ap in advance to practice inputing your measurement.

Interest in exoplanets has also significantly grown, including the signature that the atmospheres of those planets might have in the observed spectrum of a star when the planet is transiting. The Hubble Space Telescope will try to simulate this type of observation during the transit of Venus, observing the light from the Sun reflected by the Moon (if HST looked at the Sun it would be destroyed) to search for the signature of the atmosphere of Venus. You can read more about the plans on the NASA website.
Anyway I encourage you to get out there, or get online and view the last transit in our lifetime. Use the resources at transitofvenus.org, to work out the timings of the transit from your location, or search for local events. Other useful resources are the Royal Astronomical Society page on the Transit of Venus, in the UK, the HM Nautical Almanac Office. Also of possible interest, the Royal Observatory, Greenwich has a Venus Transit page, and a special (free) exhibit on transits running until September 2012. And the Planethunters project in the Zooniverse also has a special page on the transit.
On 5th/6th June 2012 Venus will pass between the Earth and the Sun. It's shadow will cross the Sun taking about 6 hours in total, although the length of that which is visible varies significantly depending on where you live on Earth. In the USA the beginning of the transit will be visible as the Sun begins to set on 5th June, while in the UK we'll see the end of the transit after the Sun rises on 6th June.
 |
| Global Visibility of the 2012 Transit of Venus. |
The planet Venus orbits the Sun inside the orbit of the Earth, and passes between the Earth and the Sun quite frequently. However the planes of the two orbits aren't quite aligned, so most of the time Venus passes either above or below the disk of the Sun. Actual transits are rare, but very predictable. They happen in pairs separated by 8 years, and then after each pair follows a period of either 121.5 or 105.5 years without any transits. The 2012 transit is the second of a pair - astronomers around the world viewed the first transit of the modern age in 2004, and the next transit won't happen until December 2117.
To view a transit of Venus does not need to be technically challenging, but in its simplest form involves looking at the Sun - so some safety precautions must be taken. You must never look directly at the Sun! Serious eye damage or even blindness could occur if you did that, so take this warning seriously! My advice for viewing the transit if you are not a keen amateur astronomer, or able to get to a viewing party, is to either get your hands on a pair of Safe Solar Viewers (like these ones from Astronomers Without Borders), or to view the event via a web cam (like this one from Hawaii where the entire transit is visible, or GLORIA which is planning to show feeds from Australia, Japan and Norway). This last method also has the advantage (especially for UK viewers) of not being affected by local cloud cover, and has exactly zero risk of eye damage! If you come to one of my talks I hope to have solar viewers to hand out.
So why should you care about a black dot crossing the Sun, or perhaps more pertinently, why do I, and an astronomer who studies galaxies, and works in a cosmology department care enough to write a blog post about it and give several talks? Well historically transits of Venus have been very important in helping astronomers understand the scale of the solar system, and from that the scale of the Universe. Basically when Venus crosses the Sun we know that it, the Sun and the Earth are all in a straight line. Very slight differences in the viewing angle from two observers on the Earth can then be used along with our basic knowledge of trigometry to measure the distance to the Sun. For over 100 years, the distance to the Sun measured this way was the most accurate measurement we had.
From knowing the distance to the Sun, we can use slight changes in the apparent position of nearby stars as the Earth orbits the Sun to get their distances (more triangles - this is called the parallax method), and from those stars we calibrate methods which use stars of known or estimated brightness to estimate distances to nearby galaxies, and we jump from distances to nearby galaxies to more distant galaxies and eventually the whole universe. The distances to faraway galaxies have taught us that the universe is expanding and started in a Big Bang around 15 billion years ago, and even if we go to the observations that suggest the universe contains a mysterious "Dark energy" (which won the 2011 Nobel Prize in Physics), they are ultimately based on us knowing the distance to the Sun. So that's why I think it's important.
Here in Portsmouth we're running a workshop about the transit of Venus on HMS Warrior, in the Portsmouth Historic Dockyard. We plan to demonstrate the triangulation method by using it to estimate the distance from the Warrior to the local landmark "The Spinnaker Tower". Two people will stand on the desk and we'll mark out from them the direction to the Spinnaker Tower. Making one of the angles a right angle, we can then estimate the distance to Spinnaker (which is about 300m) by d = b/cos A, where A is the other angle, and b is the distance between the two people on deck.
 |
| Google Map image of Portsmouth including HMS Warrior (top) and The Spinnaker Tower (bottom). |
In all of recorded history, we have records of a total of six transits of Venus that have been observed (1639, 1761, 1769, 1874, 1882 and 2004). You have to feel sorry for Johannes Kepler, who predicted the transit which occured in 1631, but then died in 1630. No-one is recorded to have used his prediction that year. Jerimiah Horrocks and Willam Crabtree (two British astronomers who were friends) have the honour of being the first humans known to have seen Venus transit. Horrocks found and improved Kepler's earlier predictions, and both men successfully observed the 1639 transit from Northern England (in December!).
Scientific observation of the transit started in the 18th century following Halley's suggestion to use it to measure the distance to the Sun. There is a hugely rich and entertaining history of these expeditions to view the transit, and several books have been published. I'm just going to tell you a couple of the stories which struck my interest! A lot more, and links to some of the books can be found via the Wikipedia page on Venus Transits, TransitofVenus.org, and TransitofVenus.nl.
For the 1761 transit, two famous explorers got involved. Mason and Dixon (still in Britain, and before they set off to map the USA) were commissioned by the Royal Society to observe the transit from Sumatra. They met in Portsmouth, and set sail from here on HMS Seahorse (which a decade later would have a famous midshipman named Horation Nelson). Enroute to Sumatra they got attacked by the French (the French and English being at war then), and decided to give up. They wrote the Royal Society of their intentions and were promptly told they better get right back on the ship to observe the transit or else. They did, and eventually ended up viewing if from South Africa.
The 1769 transit also had some famous viewers. Captain Cook was ordered to set sail in HMS Endeavour, partially to observe the transit from Tahiti, but then to continue on and look for the mythical "Australia". On that trip they didn't find Australia, but they did land and claim New Zealand. And in Tahiti, they set up a "Fort Venus" from which to stay safe from the natives and view the transit. This voyage is being repeated this year in a replica vessel, and you can follow along at the HMB Endeavour Website.

These 18th century observations results in a measurement of the distance to the Sun of 153+/-1 million kilometers, which was a huge improvement over previous estimates, but not as good as they expected. The timings were thwarted by something which came known as the "black drop effect" where the shadow of Venus seems to bleed into the edge of the Sun. This meant that the start time of the transit could not be measured to better than a few seconds.
| The black drop effect, photographed in 2004. |
In 1874 several more expeditions set out, including several on Royal Navy Ships, such as HMS Volage, one of the largest mixed sail and steam ships ever built, which ferries the British expedition to the Kerguelen Island in the Southern Indian Ocean. Such measurements helped improve the distance measurement to 149.59+/-0.3 million kilometers.
 |
| HMS Volage from the RAS Archives |
By 1881 it had been decided the distance to the Sun could be estimated better by other methods, although several expeditions still set out, and the first photographs of the transit were taken.
| A photograph of the 1882 transit, taken by a US expedition. |
The first transit of Venus to happen in the modern age was in 2004. You can find videos online of this event (like the one below), which I was lucky to view from a small observatory near Ithaca, NY while I was studying for my PhD in Astronomy at Cornell University.
For the 2012 transit, apart from encouraging people to view the event as a last in your life time chance, there are couple of new developments. First smart phone technology which didn't even exist in 2004 has allowed the development of a "Transit of Venus Ap". In this Ap you can input the time you view the transit starting and/or ending, and participate in a global experiment to measure the distance to the Sun. Download the Ap in advance to practice inputing your measurement.
Interest in exoplanets has also significantly grown, including the signature that the atmospheres of those planets might have in the observed spectrum of a star when the planet is transiting. The Hubble Space Telescope will try to simulate this type of observation during the transit of Venus, observing the light from the Sun reflected by the Moon (if HST looked at the Sun it would be destroyed) to search for the signature of the atmosphere of Venus. You can read more about the plans on the NASA website.
Anyway I encourage you to get out there, or get online and view the last transit in our lifetime. Use the resources at transitofvenus.org, to work out the timings of the transit from your location, or search for local events. Other useful resources are the Royal Astronomical Society page on the Transit of Venus, in the UK, the HM Nautical Almanac Office. Also of possible interest, the Royal Observatory, Greenwich has a Venus Transit page, and a special (free) exhibit on transits running until September 2012. And the Planethunters project in the Zooniverse also has a special page on the transit.
Wednesday, May 16, 2012
My Galaxies - Write in Starlight
Long time Zookeeper Steven Bamford has made a new website on which you can easilly write any words you like from the galaxy alphabet found by Galaxy Zoo volunteers and posted on the Forum.He's called the website: My Galaxies - Write in Starlight!


Enjoy!
Enjoy!
Wednesday, May 9, 2012
My favourite colour magnitude diagram
Cross post from the Galaxy Zoo blog.
I was embarrassed to discover today that I never got around to writing a full blog post explaining our work studying the properties of the red spirals, as I promised way back in October 2009. Chris wrote a lovely post about it "Red Spirals at Night, Astronomers Delight", and in my defense new science results from Zoo2, and a few other small (tiny people) things distracted me.
I won't go back to explaining the whole thing again now, but one thing missing on the blog is the colour magnitude diagram which demonstrates how we shifted through thousands of galaxies (with your help) to find just 294 truly red, disc dominated and face-on spirals.
A colour magnitude diagram is one of the favourite plots of extragalactic astronomers these days. That's because galaxies fall into two distinct regions on it which are linked to their evolution. You can see that in the grey scale contours below which is illustrating the location of all of the galaxies we started with from Galaxy Zoo. The plot shows astronomical colour up the y-axis (in this case (g-r) colour), with what astronomers call red being up and blue dow. Along the x-axis is absolute magnitude - or astronomers version of how luminous (how many stars effectively) the galaxy is. Bigger and brighter is to the right. So you see the greyscale indicating a "red sequence" at the top, and a "blue cloud" at the bottom. In both cases brighter galaxies are redder.
The standard picture before Galaxy Zoo (ie. with small numbers of galaxies with morphological types) was that red sequence galaxies are ellipticals (or at least early-types) and you find spirals in the blue cloud. The coloured dots on this picture show the face-on spirals in the red sequence (above the line which we decided was a lower limit to be considered definitely on the red sequence). The different colours indicate how but the bulge is in the spiral galaxy - in the end we only included in the study the green and blue points which had small bulges, since we know the bulges of spiral galaxies are red. These 294 galaxies represented just 6% of spiral galaxies of their kind.
So this is one of my favourite versions of the colour magnitude diagram.
Thursday, May 3, 2012
Beautiful Galaxy M106
The next in my series of beautiful galaxies is inspired by today's Astronomy Picture of the Day Image.
This is a composite Hubble Space Telescope and ground based (from NOAO) image. The ground based image was used to add colour to the high resolution single filter (ie. black and white) image from HST.
M106 has traditionally been classified as an unbarred Sb galaxies (although some astronomers claim a weak bar). In the 1960s it was discovered that if you look at M106 in radio and X-ray two additional "ghostly arms" appear, almost at right angles to the optical arms. These are explained as gas being shock heated by jets coming out of the central supermassive black hole (see Spitzer press release).
Messier 106 (or NGC 4258) is an extremely important galaxy for astronomers, due to it's role in tying down the extragalactic distance scale. A search in the NASA Extragalactic Database (NED) will reveal this galaxy has 55 separate estimates of its distance, using many of the classic methods on the Cosmic distance ladder. Most importantly, M106 was the first galaxy to have an geometric distance measure using a new method which tracked the orbits of clumps of gas moving around the supermassive black hole in its centre. This remains one of the most accurate extragalactic distances ever measured with only a 4% error (7.2+/-0.3 Mpc, or 22+/-1 million light years). The error can be so low, because the number of assumptions is small (it's based on our knowledge of gravity), and as a geometrically estimated distance it leap frogs the lower rungs of the distance ladder.
This result was published in Nature in 1999: A geometric distance to the galaxy NGC4258 from orbital motions in a nuclear gas disk, Hernstein et al. 1999 (link includes an open access copy on the ArXiV).
Because M106 has so many different distances estimated using so many different methods, and is anchored by the extremely accurate geometric distance, it helps us to calibrate the distances to many other galaxies. Almost all cosmological results, and any result looking at the masses, or physical sizes of galaxies need a distance estimate.
So M106 is not only beautiful, it's important.
I've cross listed this post at the Galaxy Zoo blog.
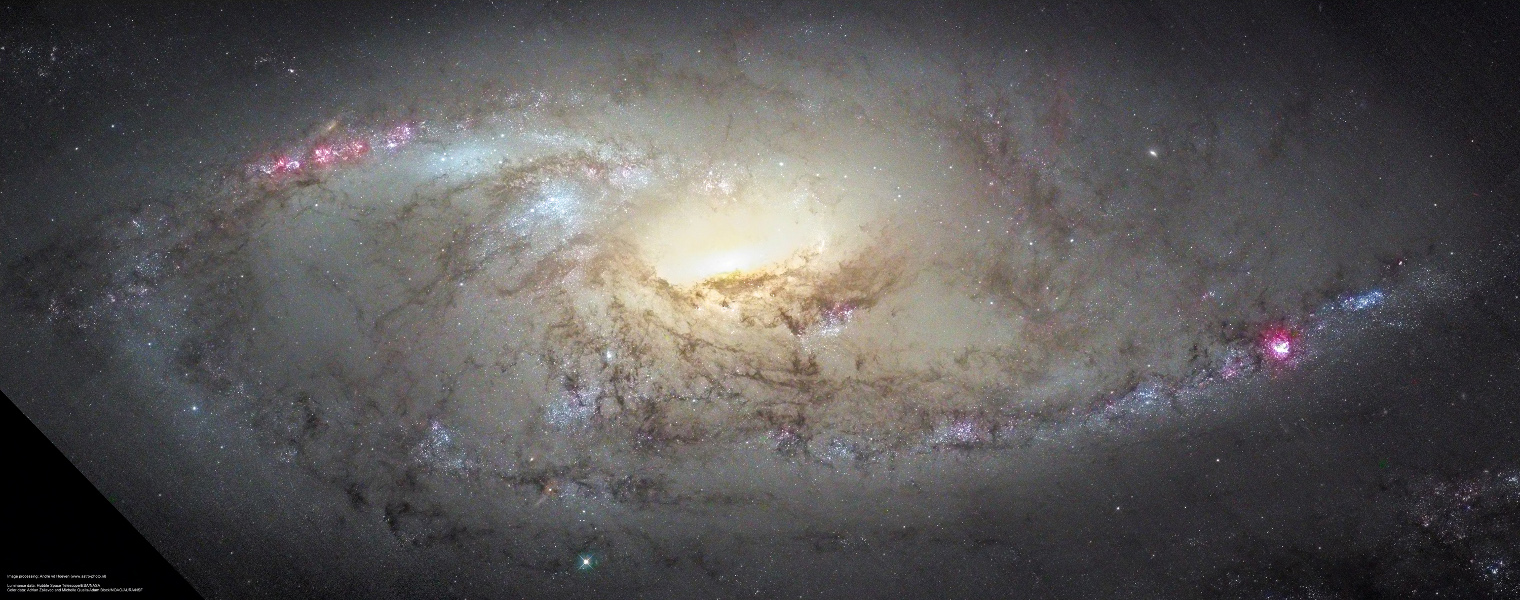 |
| M106 Close Up (from APOD) Credit: Composite Image Data - Hubble Legacy Archive; Adrian Zsilavec, Michelle Qualls, Adam Block / NOAO / AURA / NSF Processing - André van der Hoeven |
This is a composite Hubble Space Telescope and ground based (from NOAO) image. The ground based image was used to add colour to the high resolution single filter (ie. black and white) image from HST.
M106 has traditionally been classified as an unbarred Sb galaxies (although some astronomers claim a weak bar). In the 1960s it was discovered that if you look at M106 in radio and X-ray two additional "ghostly arms" appear, almost at right angles to the optical arms. These are explained as gas being shock heated by jets coming out of the central supermassive black hole (see Spitzer press release).
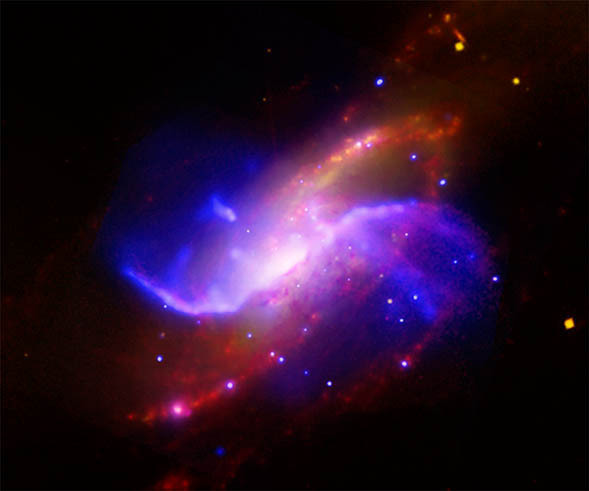 |
| In this composite image of spiral galaxy M106 (NGC 4258), optical data from the Digitized Sky Survey is shown as yellow, radio data from the Very Large Array appears as purple, X-ray data from Chandra is coded blue, and infrared data from the Spitzer Space Telescope appears red. Credit: |
Messier 106 (or NGC 4258) is an extremely important galaxy for astronomers, due to it's role in tying down the extragalactic distance scale. A search in the NASA Extragalactic Database (NED) will reveal this galaxy has 55 separate estimates of its distance, using many of the classic methods on the Cosmic distance ladder. Most importantly, M106 was the first galaxy to have an geometric distance measure using a new method which tracked the orbits of clumps of gas moving around the supermassive black hole in its centre. This remains one of the most accurate extragalactic distances ever measured with only a 4% error (7.2+/-0.3 Mpc, or 22+/-1 million light years). The error can be so low, because the number of assumptions is small (it's based on our knowledge of gravity), and as a geometrically estimated distance it leap frogs the lower rungs of the distance ladder.
This result was published in Nature in 1999: A geometric distance to the galaxy NGC4258 from orbital motions in a nuclear gas disk, Hernstein et al. 1999 (link includes an open access copy on the ArXiV).
Because M106 has so many different distances estimated using so many different methods, and is anchored by the extremely accurate geometric distance, it helps us to calibrate the distances to many other galaxies. Almost all cosmological results, and any result looking at the masses, or physical sizes of galaxies need a distance estimate.
So M106 is not only beautiful, it's important.
I've cross listed this post at the Galaxy Zoo blog.
Subscribe to:
Posts (Atom)